

Sajjad Ahmadi
Power BI Data Visualization Specialist at datatraining.io- Claim this Profile

Click to upgrade to our gold package
for the full feature experience.
-
Persian Native or bilingual proficiency
-
English Professional working proficiency
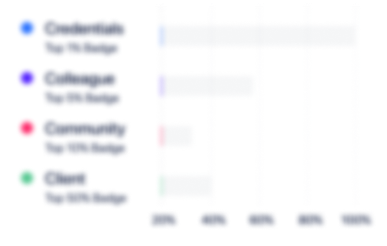
Topline Score
Bio
Credentials
-
Dashboard Design Concepts
DataCampSep, 2023- Sep, 2024 -
A/B Testing in Python
365 Data ScienceNov, 2022- Sep, 2024 -
Building Business Reports Using Power BI
365 Data ScienceNov, 2022- Sep, 2024 -
Introduction to DAX
365 Data ScienceNov, 2022- Sep, 2024 -
Power BI
365 Data ScienceNov, 2022- Sep, 2024 -
Power Query and Data Modeling
365 Data ScienceNov, 2022- Sep, 2024 -
C2 Proficient
EF Standard English Test (EF SET)Sep, 2022- Sep, 2024 -
Analyzing Data with Microsoft Power BI Path
Dataquest.ioJul, 2022- Sep, 2024 -
Deploying and Maintaining Assets in Power BI
DataCampJul, 2022- Sep, 2024 -
Introduction to Data Visualization with Plotly in Python
DataCampJul, 2022- Sep, 2024 -
Power BI Essential Training
LinkedInJul, 2022- Sep, 2024 -
User-Oriented Design in Power BI
DataCampJul, 2022- Sep, 2024 -
Data Analysis with Python
freeCodeCampMay, 2022- Sep, 2024 -
Ultimate Beginners Guide to Power BI - Structured Courses
Enterprise DNA LtdApr, 2022- Sep, 2024 -
Intermediate PostgreSQL
University of Michigan | CourseraMar, 2022- Sep, 2024 -
Analyzing Company Performance using Ratios
CourseraFeb, 2022- Sep, 2024 -
Build a Budget and Analyze Variance using Google Sheets
CourseraFeb, 2022- Sep, 2024 -
Excel Skills for Business Forecasting Specialization
CourseraFeb, 2022- Sep, 2024 -
Hypothesis Testing with Python and Excel
CourseraFeb, 2022- Sep, 2024 -
Python Basics for Data Analysis Path
Dataquest.ioFeb, 2022- Sep, 2024 -
Statistics for Marketing
CourseraFeb, 2022- Sep, 2024 -
Database Design and Basic SQL in PostgreSQL
University of Michigan | CourseraJan, 2022- Sep, 2024 -
SQL Fundamentals Path
Dataquest.ioJan, 2022- Sep, 2024 -
Data Analysis Using Python
University of Pennsylvania - CourseraDec, 2021- Sep, 2024 -
New world. New skills: Power BI Virtual Case Experience
PwCDec, 2021- Sep, 2024 -
SQL (Basic)
HackerRankDec, 2021- Sep, 2024 -
SQL (Intermediate)
HackerRankDec, 2021- Sep, 2024 -
Certificate of achievement - Data Analyst
365 Data ScienceNov, 2021- Sep, 2024 -
Applied Data Science with Python - Level 2
IBMSep, 2021- Sep, 2024 -
Data Analytics for Lean Six Sigma
CourseraApr, 2021- Sep, 2024 -
Giving Helpful Feedback
CourseraApr, 2021- Sep, 2024
Experience
-
datatraining.io
-
Germany
-
IT Services and IT Consulting
-
1 - 100 Employee
-
Power BI Data Visualization Specialist
-
Jul 2023 - Present
-
-
-
Freelance
-
Egypt
-
Human Resources
-
1 - 100 Employee
-
Reporting Analyst
-
Apr 2022 - Aug 2023
I work and accept any project related to creating reports and developing BI dashboards. Also, I write about my data journey and Power BI tips and tricks on my Medium blog. When I work on my projects, I mostly use these tools and technologies to create my reports and dashboards: 🟨 Power BI as my main data exploration and BI tool ⬜ Inside Power BI, I know how to implement data modelling, how to use DAX and Power Query ⬜ For designing my reports and dashboards I use Adobe Illustrator and sometimes Power Point ⬜ I use HTML, CSS and sometimes Deneb to create custom visuals inside Power BI ⬜ For creating advanced charts, like HexBin and Contour charts, I use matplotlib and seaborn library of Python Show less
-
-
-
-
Book Seller
-
2021 - 2021
During my job, I gained good communication and negotiation skills both with my boss and customers. I read many novels and anthropology and psychology books, and part of my job was to recommend books based on my readings. I left this job because I wanted to challenge myself and gain more technical skills. During my job, I gained good communication and negotiation skills both with my boss and customers. I read many novels and anthropology and psychology books, and part of my job was to recommend books based on my readings. I left this job because I wanted to challenge myself and gain more technical skills.
-
-

Education
-
2021 - 2022

Udacity
Business Analytics Nanodegree, Pass -
2016 - 2020
University of Tehran
Bachelor's degree, Mining and Mineral Engineering
Community