Anoop Kumar
Business Intelligence Analyst at USEReady- Claim this Profile
Click to upgrade to our gold package
for the full feature experience.
Topline Score


Bio


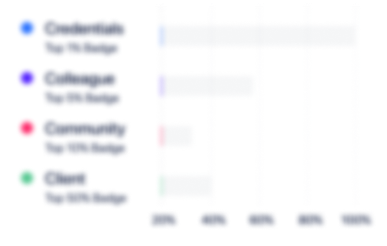
Credentials
-
Tableau Desktop Specialist
TableauJun, 2023- Nov, 2024 -
Microsoft Certified: Azure Data Fundamentals
MicrosoftDec, 2022- Nov, 2024 -
Certified Data Scientist
SimplilearnMay, 2021- Nov, 2024 -
Data Science Capstone
SimplilearnMay, 2021- Nov, 2024 -
Simplifying data pipelines with Apache Kafka
IBMApr, 2021- Nov, 2024 -
Big Data Hadoop and Spark Developer
SimplilearnMar, 2021- Nov, 2024 -
Statistics Essential for Data Science
SimplilearnMar, 2021- Nov, 2024 -
Build Your Own Chatbot - Level 1
IBMFeb, 2021- Nov, 2024 -
Data Visualization with R
IBMFeb, 2021- Nov, 2024 -
IBM Watson for Chatbots
SimplilearnFeb, 2021- Nov, 2024 -
Machine Learning with R by IBM
SimplilearnFeb, 2021- Nov, 2024 -
Python for Data Science
IBMFeb, 2021- Nov, 2024 -
Tableau Desktop 10
SimplilearnOct, 2020- Nov, 2024 -
Machine Learning Advanced Certification Training
SimplilearnSep, 2020- Nov, 2024 -
Data Science with Python
SimplilearnAug, 2020- Nov, 2024 -
Data Science with R
SimplilearnJun, 2020- Nov, 2024
Experience
-
USEReady
-
United States
-
Data Infrastructure and Analytics
-
300 - 400 Employee
-
Business Intelligence Analyst
-
May 2022 - Present
• Connecting different data sources using the data-blending, Join, Union, Relationships feature. • Responsible for interaction with business users, gathering requirements, and managing the delivery. • Build wireframes in FIGMA for the project. • Complete migration dashboard QlikView to Tableau. • Understand QlikView code using existing and not-exists SQL concepts and inline. • Build data flow with Tableau prep then get output as a single file. • Represent data using a Bar… Show more • Connecting different data sources using the data-blending, Join, Union, Relationships feature. • Responsible for interaction with business users, gathering requirements, and managing the delivery. • Build wireframes in FIGMA for the project. • Complete migration dashboard QlikView to Tableau. • Understand QlikView code using existing and not-exists SQL concepts and inline. • Build data flow with Tableau prep then get output as a single file. • Represent data using a Bar chart, Cross tab, Map, Pie chart, and Scatter plot. • Build advanced charts and visualization such as Pareto charts and Donut chart • Responsible for dashboard design and its layout. • Ensured projects were completed on time. • Developed a customized dashboard using the filter. Show less • Connecting different data sources using the data-blending, Join, Union, Relationships feature. • Responsible for interaction with business users, gathering requirements, and managing the delivery. • Build wireframes in FIGMA for the project. • Complete migration dashboard QlikView to Tableau. • Understand QlikView code using existing and not-exists SQL concepts and inline. • Build data flow with Tableau prep then get output as a single file. • Represent data using a Bar… Show more • Connecting different data sources using the data-blending, Join, Union, Relationships feature. • Responsible for interaction with business users, gathering requirements, and managing the delivery. • Build wireframes in FIGMA for the project. • Complete migration dashboard QlikView to Tableau. • Understand QlikView code using existing and not-exists SQL concepts and inline. • Build data flow with Tableau prep then get output as a single file. • Represent data using a Bar chart, Cross tab, Map, Pie chart, and Scatter plot. • Build advanced charts and visualization such as Pareto charts and Donut chart • Responsible for dashboard design and its layout. • Ensured projects were completed on time. • Developed a customized dashboard using the filter. Show less
-
-
-
Galaxy Weblinks Inc
-
United States
-
IT Services and IT Consulting
-
700 & Above Employee
-
PHP Developer
-
Aug 2019 - Apr 2020
• Performed dynamic operations. Created a chat system with PHP & MySQL. • Worked on real estate & tutorial website & solved website related queries • Performed dynamic operations. Created a chat system with PHP & MySQL. • Worked on real estate & tutorial website & solved website related queries
-
-
-
website and App Development(self-working)
-
Itarsi, Madhya Pradesh, India
-
Professional Freelancer
-
Jun 2016 - Jun 2019
• Using JavaScript to fix the time-clock bug. • Using jQuery to fix responsiveness issues. • Removed some unused scripts on web pages that make bug-free pages. • Responsible for mock-up design and its layout. • Using hide/show CSS features on web pages. • Using Bootstrap Templates for client projects. • Using JavaScript to fix the time-clock bug. • Using jQuery to fix responsiveness issues. • Removed some unused scripts on web pages that make bug-free pages. • Responsible for mock-up design and its layout. • Using hide/show CSS features on web pages. • Using Bootstrap Templates for client projects.
-
-
Community


